Early Childhood Learning Programs
San Francisco, CA
The new application replaced complex Excel spreadsheets that E4 was using to track data and improvement plans from site specialists throughout California.
The E4 application development arose by chance: while discussing the public-facing website development for E4, the team mentioned their plans to use complex Excel spreadsheets to track data and improvement plans from site specialists throughout California. We suggested that designing and building a custom application in Ruby that would simplify an otherwise laborious process, and help save them time and headaches related to data management. And thus a rapid design process began.
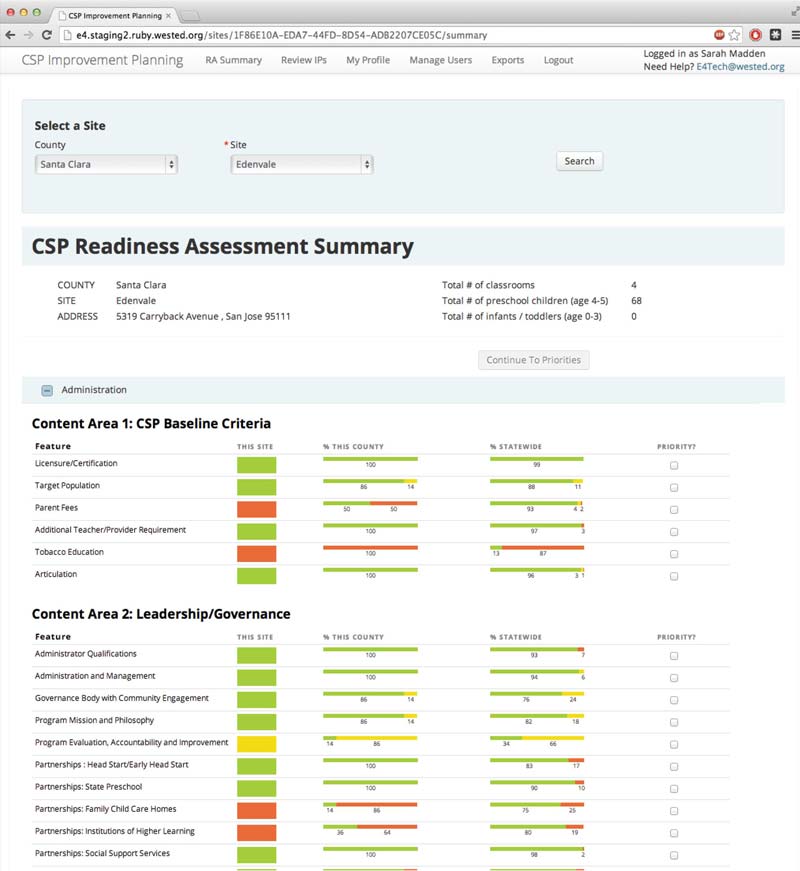
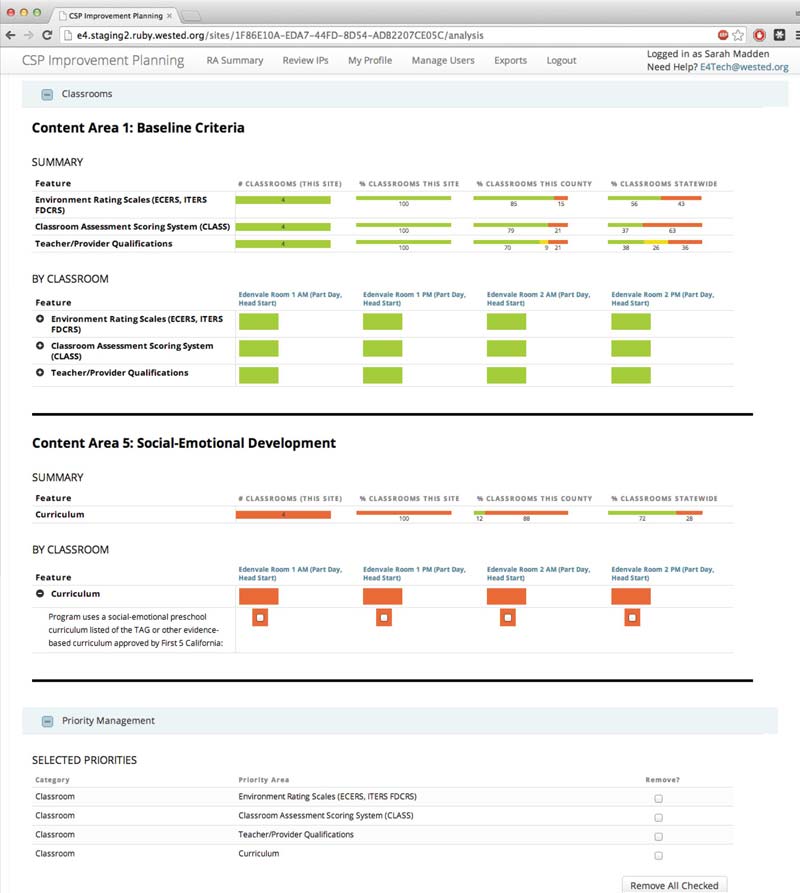
We built the application in two phases of design sprints, keeping the UX and visual design as simple, streamlined, and user-friendly as possible—the target users are early childhood caregivers who aren’t always comfortable with slick technology applications—and providing the E4 team a clear interface to evaluate, approve, and track the in-progress and finalized assessments and plans. My favorite bit of flair in the application is the interactive data visualization of how the ratings at a site compare to that at the county level and the state, so site coordinators can identify, at-a-glance, the most important focus areas for improvement.
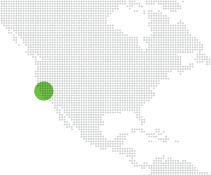
Evaluation at a Glance
The goal for the application was to provide the E4 team with a clear interface to evaluate, approve, and track the in-progress and finalized assessments and plans. The first set of screenshots depicts the "report card" rating view of the interface. Easy-to-read color coding and small, comparable graphs are designed to make it easy to comprehend a site's assessment at a glance.
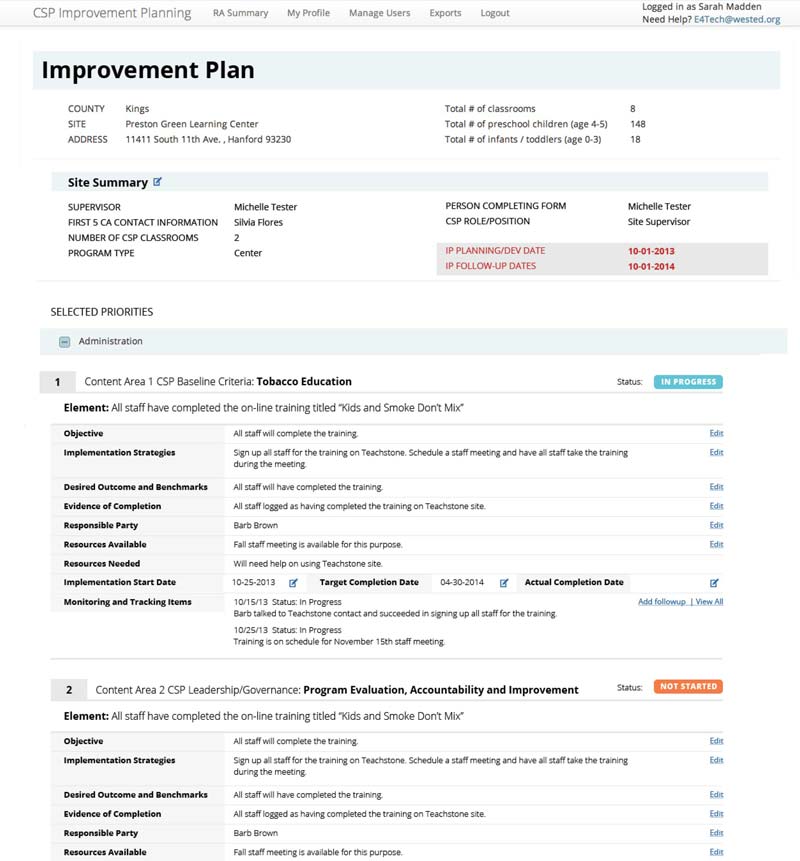
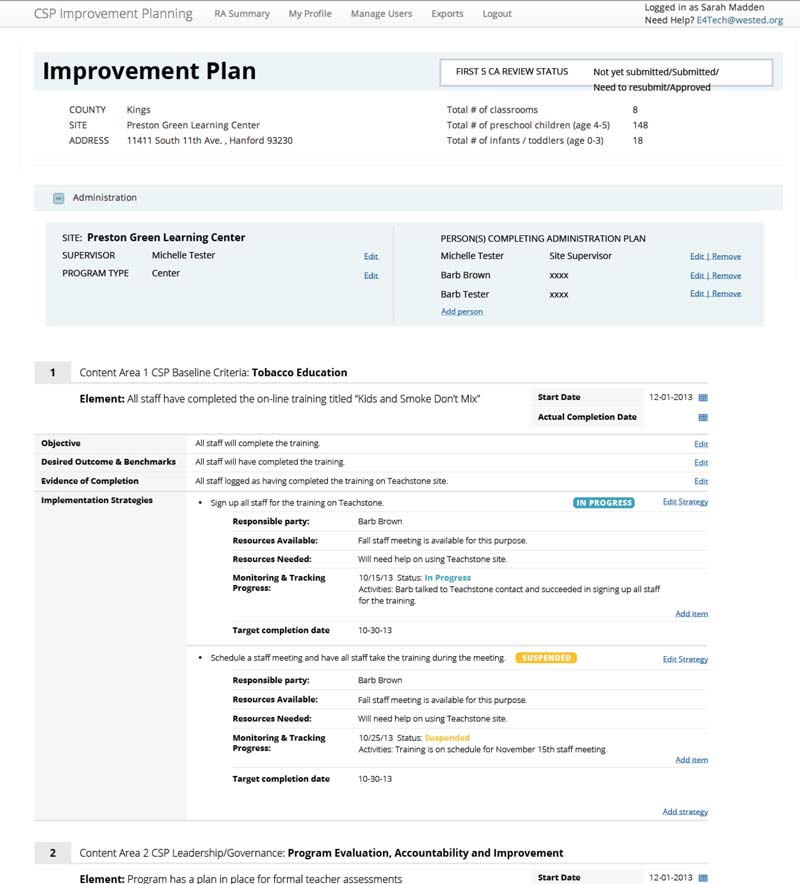
Making Improvement Plans
The second process for the application is enabling individual site providers to respond to their ratings by entering their improvement plans for each item.
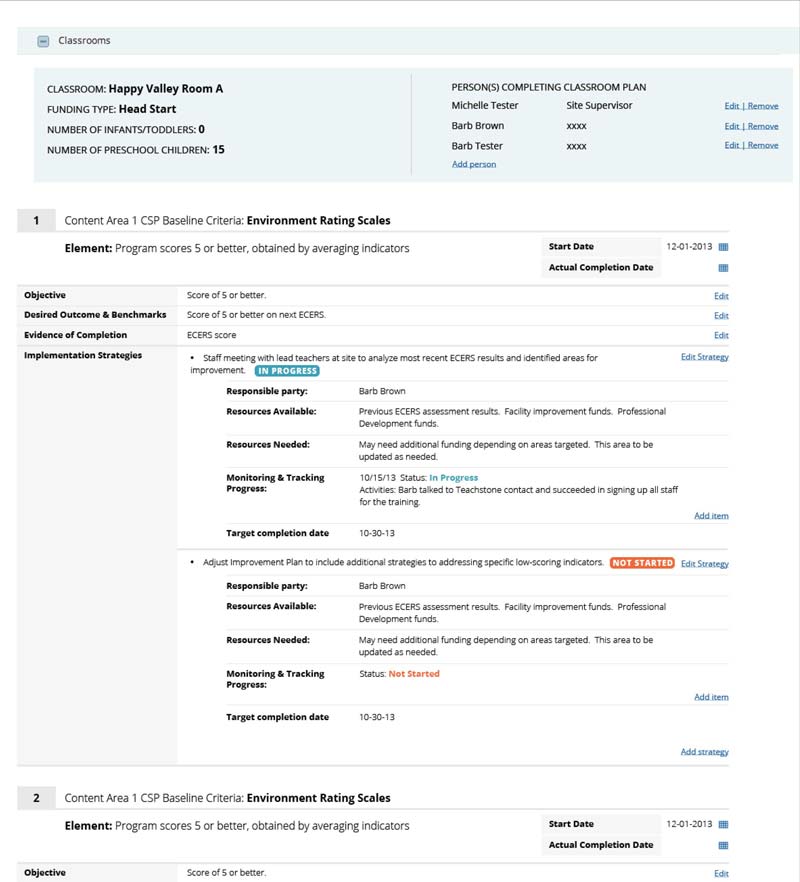
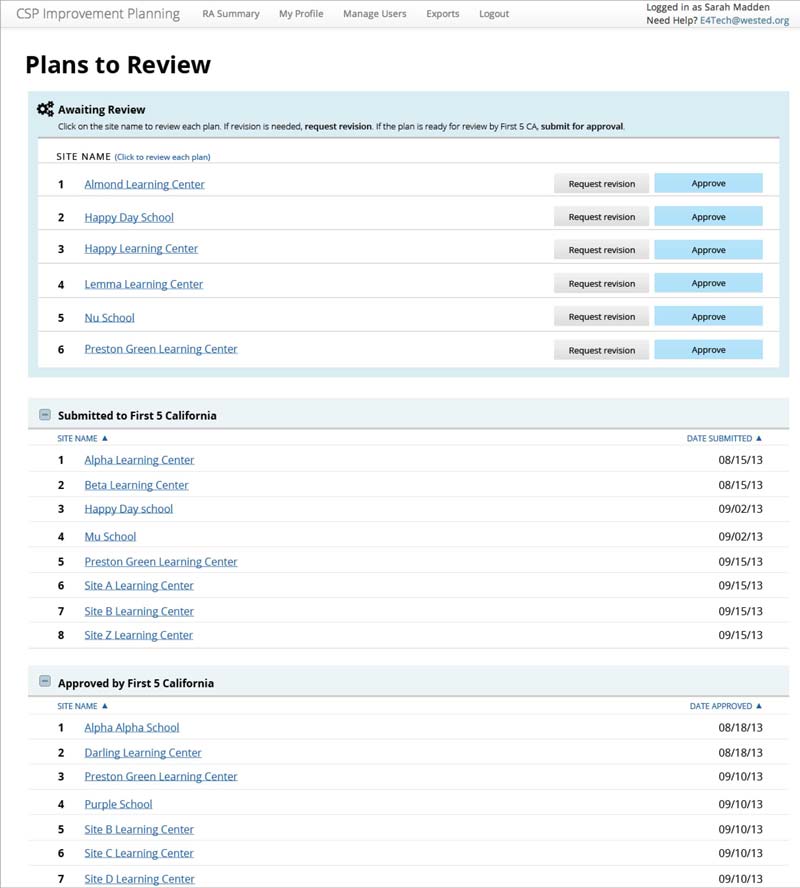
Tracking Progress
Lastly, the application makes it easy E4 administrators to track data and improvement plans from site specialists throughout California.