Illustrating Connections
San Francisco, CA

This visualization was created as a fun project with AJ Farkas, front-end developer.
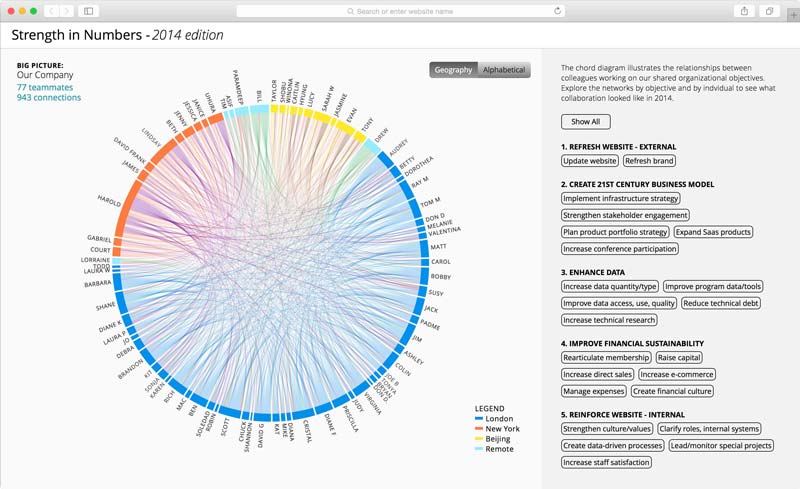
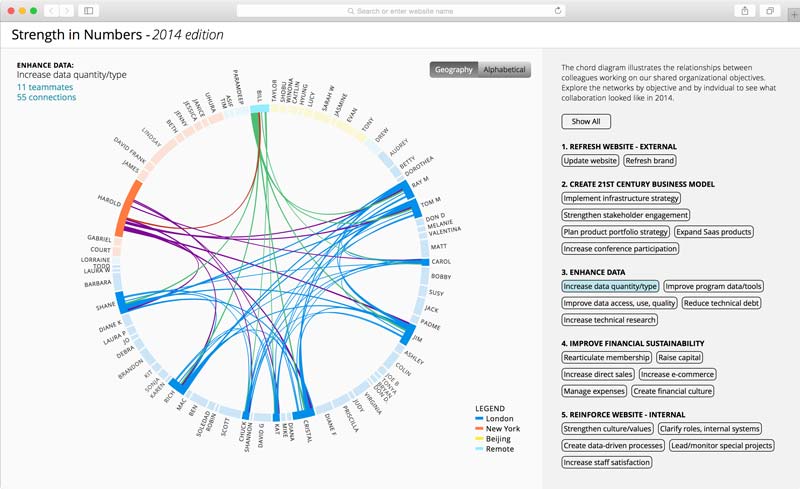
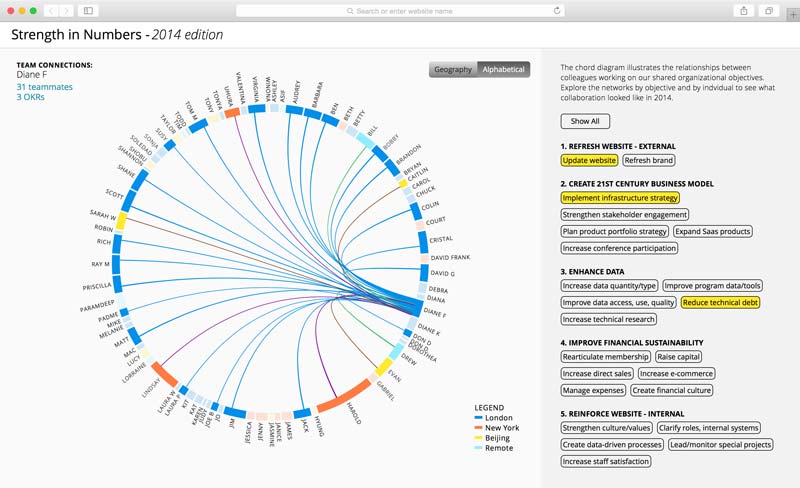
This D3-based chord diagram illustrates the relationships between colleagues working on an organization's shared objectives. Explore the networks by objective and by individual to see what their collaboration looked like in 2014.
Details
The chord diagram illustrates the relationships between colleagues working on our shared organizational objectives. Explore the networks by objective and by indvidual to see what collaboration looked like in 2014.